Article Text

Abstract
Background The aim of the study was to better characterise the immunological origin and the behaviour of interleukin (IL)-23-responsive innate lymphoid cells (ILCs) in the gut, synovial fluid (SF) and bone marrow (BM) of patients with ankylosing spondylitis (AS).
Methods ILC1, ILC2 and ILC3 cells were determined and characterised by confocal microscopy and flow cytometry in ileal and BM biopsies, in peripheral blood (PB) and SF mononuclear cells obtained from patients with AS and controls. Mucosal vascular addressin cell adhesion molecule 1 (MADCAM-1), IL-7, IL-15 and aggregates of lymphoid tissue inducer cells (LTi) were evaluated by immunohistochemistry. The in vitro ability of epithelial cells in driving the differentiation of ILC3 and the effect of tumour necrosis factor inhibitors (TNFi) on the frequency of ILC3 and the expression of MADCAM1 were also assessed.
Results ILC3 characterised as Lyn−RORc−Tbet+ NKp44+ cells were significantly expanded in the gut, SF and BM of patients with AS compared with controls, produced high levels of IL-17 and IL-22 and expressed α4β7. MADcAM1 was overexpressed in BM and ileal high endothelial venules. IL-7 was significantly increased in AS gut, especially in the context of Paneth cells, and accompanied by the presence of aggregates of c-kit/IL-7R+ cells (LTi). In in vitro experiments, epithelial cells from patients with AS actively induced differentiation of ILC3 from LTi. TNFi efficacy was accompanied by a significant decrease in the percentage of intestinal and circulating ILC3 and in the expression of MADCAM1.
Conclusions Gut-derived IL-17+ and IL-22+ILC3 are expanded in the peripheral blood, SF and inflamed BM of patients with AS, suggesting the presence of an active homing axis between the gut and the inflamed sacroiliac joints.
- Ankylosing Spondylitis
- Inflammation
- Cytokines
Statistics from Altmetric.com
Introduction
Interleukin (IL)-23 is considered to be a central cytokine in ankylosing spondylitis (AS).1 ,2 The intestine appears to be the main site of IL-23 production,2 ,3 and there is emerging clinical evidence that blocking IL-23 in AS may be effective.4
IL-23-sensitive entheseal resident T cells (IL-23R+RAR-related orphan receptor γt (ROR-γt)(+)CD3(+)CD4(−)CD8(−), stem cell antigen 1 (Sca1)(+) cells) have been observed in a murine model of AS.5 These cells have been found to release IL-17 and IL-22, cytokines considered important actors in driving spinal inflammation and osteoproliferation.5 Although well characterised from a phenotypic point of view, these cells have not been demonstrated in humans, and the exact nature of these cells and their developmental origin in patients with AS remain elusive. Interestingly, these cells share several immunological similarities with specific subsets of innate lymphoid cells (ILCs).
ILCs populations are specialised cells involved in the regulation of innate immunity and inflammation through the secretion of polarised cytokines and chemokines.6 Based on the cytokine properties, ILCs are classified into three groups (ILC1, ILC2 and ILC3): ILC1 express the transcription factor T-bet, produce interferon-γ (IFN-γ) and mediate immunity against intracellular pathogens and tumors7; ILC2 mainly produce IL-5 and IL-13; ILC3s are an important source of ‘type 17’ cytokines, IL-22 and IL-17, in response to IL-23, express the retinoic acid-ROR-γ and are required for mediating immunity to extracellular bacterial infections,8 also providing help to marginal zone B cells,9 and may also play a proinflammatory role.10 ILC3 seem to be essentially mucosal-restricted cells, developmentally related to lymphoid tissue-induced cells (LTi) and dependent on IL-7 for their differentiation.11 ,12 These ROR-γ+ cells are essentially involved in protective response by negatively regulating Th17 cells through the modulation of intestinal microflora.13 ,14 Specifically in the gut of patients with AS, ILC3 expressing the natural cytotoxicity receptor NKp44 are significantly expanded, produce IL-22 and induce mucins production and goblet cells hyperplasia.15 Although the ligand for NKp44 in normal tissues has not yet been identified, it seems to bind to an unusual isoform of the mixed lineage leukaemia-5 protein.16 The continued engagement of NKp44 and cytokine receptors, however, seems to induce a potent proinflammatory programme in NKp44+ILC3 cells.10
Since the prevalent expression of IL-23 in the gut of patients with AS2 and the strong expansion of NKp44+ILC3s we previously demonstrated,15 in this study we aimed to better characterise ILC3 and to study ILC1 and ILC2 in the gut of AS. In consideration of the role of the α4β7 integrin in promoting homing of immune cells to intestinal site,17 the aim of this study was also to verify whether gut-derived ILCs may express the α4β7 integrin and recirculate in the peripheral blood, inflamed bone marrow (BM) and synovial fluid of patients with human leucocyte antigen (HLA)-B27 AS.
Methods
Patients
Thirty consecutive patients with HLA-B27affected by AS diagnosed according to the New York classification criteria18 were considered for this study. All the patients had to have active disease defined as a Bath ankylosing spondylitis disease activity index (BASDAI)19–20 of 4 or more and a positive MRI scan of sacroiliac (SI) joints. Multiple adjacent ileal mucosal biopsies were obtained from all the patients with AS. Fifteen healthy subjects, undergoing ileocolonoscopy for diagnostic purposes but without evidence of underlying disease, were also consecutively enrolled and considered as controls (baseline characteristics of patients and controls are specified in online supplementary table S1). Peripheral blood mononuclear cells (PBMCs) were obtained from all the patients and controls. Synovial fluid was obtained from 4 out of the 30 patients with AS and from additional 5 patients with osteoarthritis. Additional five patients with HLA-B27+, with nrAxSpA and SI joints involvement as demonstrated by MRI were considered for this study. These patients displayed hypergammaglobulinemia (<3 g/dL) and were referred by haematologist to undergo BM biopsy after informed consent, suspecting gammopathy of undetermined significance (MGUS) for diagnostic purpose. BM samples obtained from five patients with hypergammaglobulinemia, without any history of inflammatory joint disease, undergoing BM biopsy for diagnostic purpose were considered as controls. Plasma cells were <10% in all the patients and displayed a normal phenotype (CD38+CD56−CD19+). Finally, peripheral blood and gut samples were obtained from five out of the 30 patients with AS after anti-tumour necrosis factor (TNF)α therapy (three adalimumab and two infliximab, mean duration of treatment 16±6 months).
Histomorphological grading and immunohistochemistry
Gut specimens from patients with AS were divided according to the histological results as previously described21 into three groups: normal gut histology (n=10), acute (n=8) and chronic (n=12) inflammation. Immunohistochemistry was performed as previously described3 on ileal samples obtained from patients with AS and controls and tonsils (considered as positive controls). A list of primary and secondary antibodies used is provided in online supplementary table S2. The number of positive cells was determined by counting positively stained cells on photomicrographs obtained from three random high-power microscopic fields (400× magnification) under a Leica DM2000 optical microscope, using a Leica DFC320 digital camera (Leica, Rijswijk, the Netherlands). To specifically address the presence of cryptopatches and ILCs, triple stainings were performed on paraffin-embedded sections of human ileum and the sections were treated with FITC-, Rhodamine Red or Cy-5-conjugated antimouse or antirabbit antibodies (Invitrogen), plus RNasi (200 ng/mL) and counterstained using Toto-3 iodide (642/660; Invitrogen) or 4′,6-diamidino-2-phenylindole (DAPI) (Life Technologies). Confocal analysis was used to acquire fluorescence staining.
RNA extraction and quantitative TaqMan real-time PCR (RT-PCR) for ileal biopsies
Total RNA was extracted using the Qiagen RNeasy Mini kit, with on-column DNase I digestion. A total of 1 μg of RNA was reverse-transcribed to complementary DNA (cDNA) using a ThermoScript First-Strand cDNA Synthesis kit (Invitrogen). For quantitative TaqMan real-time PCR, sets of primers and probes were obtained from Applied Biosystems (see online supplementary table S2). Samples were run in triplicate using the Step-One Real-Time PCR system (Applied Biosystems). Relative changes in gene expression between controls and patients were determined using the ΔΔCt method as previously described. Final values were expressed as fold of induction.
Flow cytometry analysis of surface and intracellular antigens
Lamina propria mononuclear cells (LPMCs), PBMCs, synovial mononuclear cells and BM mononuclear cells were respectively isolated from the gut, the peripheral blood, synovial fluid and BM of patients with AS and healthy controls as previously described.3 For detection of intracellular cytokine production, cells were stimulated with phorbol myristate acetate (60 ng/mL) and inomycin (1 μg/mL) as previously described.22 A list of the antibodies used is provided in online supplemental table S2. Flow cytometric analysis was performed using a FACSCanto and FACScalibur (Becton Dickinson), and cell death was assessed by trypan blue exclusion. At least 50 000 cells (events) were acquired for each sample. LPMCs were expressed as percentage of cells within the lymphocyte gate. The acquired data were analysed using the CellQuest and FlowJo software programs.
Cell cultures
In order to evaluate the role of epithelial cells in regulating the differentiation of ILCs type 3, epithelial cell fraction was isolated from LPMC as described by Van Damme et al.23 CD117+ lin− precursor-enriched mononuclear cells were isolated from tonsils obtained from normal donors using lineage-marker (negative depletion with antibodies to CD5, CD45R (B220), CD11b, Gr-1 (Ly-6G/C), 7-4 and Ter-119) and c-kit microbeads (positive selection) and magnetic-activated cell sorting techniques (Miltenyi Biotech GmbH, Bergisch Gladbach, Germany) according to the manufacturer’s instructions. Isolated CD117+lin- were then cultured with intestinal epithelial cell fraction (1:1), and the percentage of ILC3 was assessed by flow cytometry. All cultures were set up in triplicate and cells were used for flow cytometric analyses.
Statistical analysis
Student’s t test or the non-parametric Mann–Whitney test was used to calculate the statistical significance between groups. Spearman’s rank correlation was performed to correlate the number of ILC3 with the disease activity assessed by BASDAI in AS. p Values <0.05 were considered significant.
Results
ILC3, but not ILC1 and ILC2, is expanded in the gut of AS and is developmentally related to LTi cells
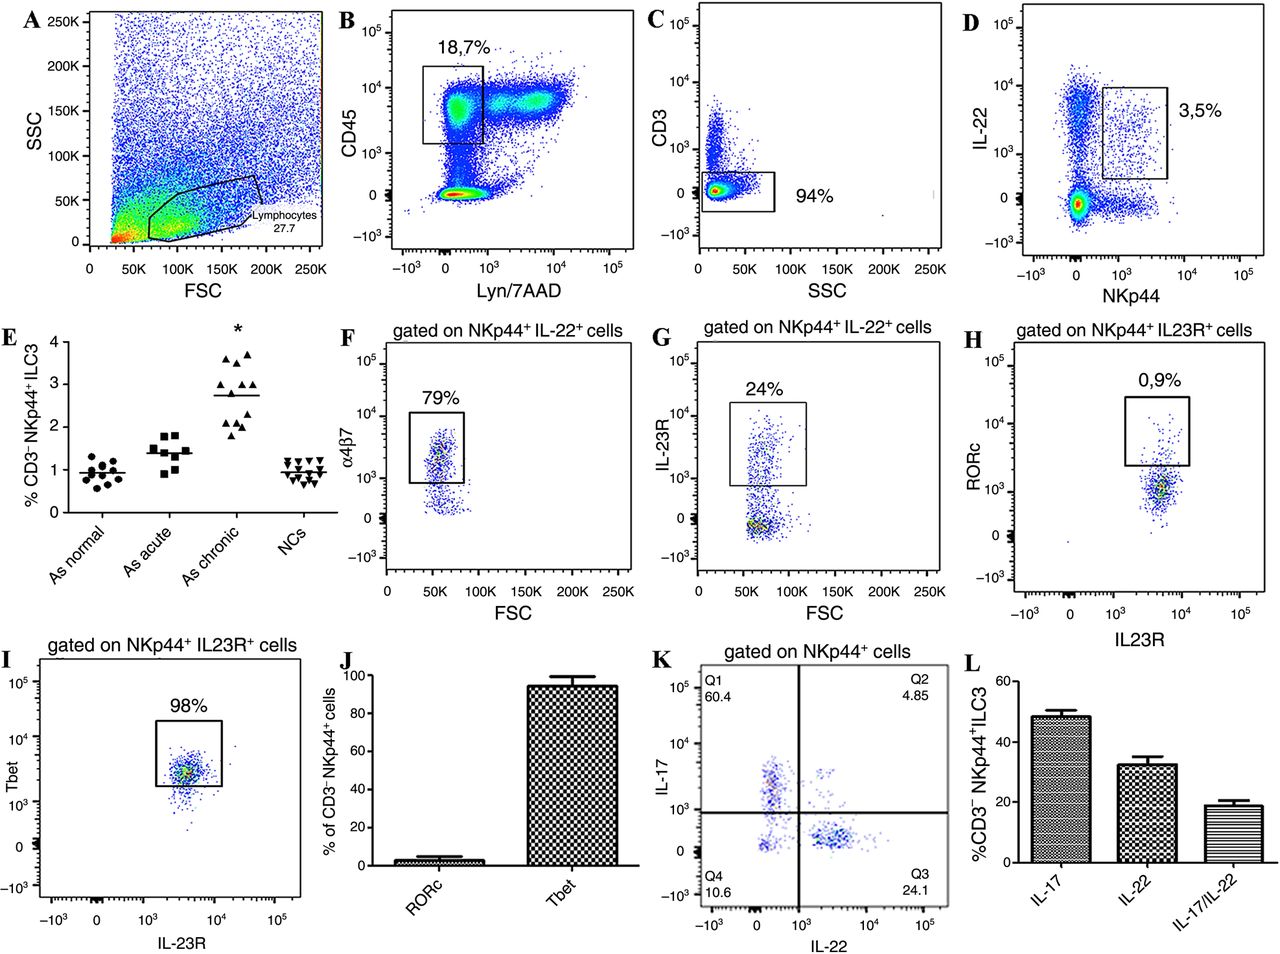
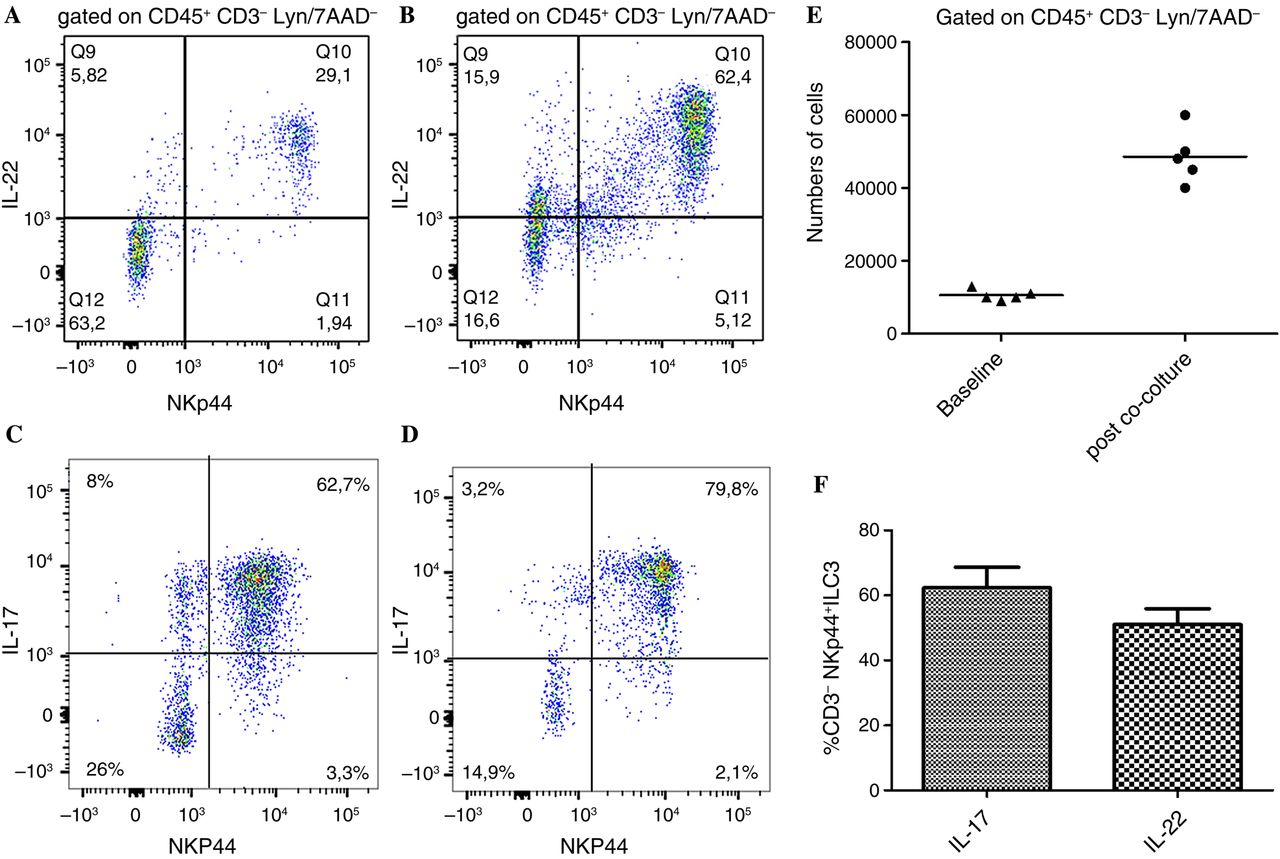
ILC populations were assessed by flow cytometry and confocal microscopy analysis. As shown in online supplementary figure S1, no significant expansion of ILC1 (see online supplementary figure S1A–E, K, L) and/or ILC2 (see online supplementary figure S1F–J, M, N) was observed in the gut of patients with AS, independently by the level of inflammation, as compared to controls. Conversely, by confocal analysis we demonstrated a consistent expansion of NKp44+ILC3 in patients with AS with acute and chronic gut inflammation (see online supplementary figure S2A–E) significantly correlated with the disease activity as assessed by the BASDAI (r2=0.69, p<0.001) (see online supplementary figure S2F).24 The expansion of ILC3 was confirmed by flow cytometry (figure 1A–E and online supplementary figure S3). These cells were characterised by the expression of the natural cytotoxic receptor (NCR) NKp44 (figure 1D), were negative for CD4, CD8, CD56, CD14, CD19, TCRγδ and iNKT (Lyn−) (figure 1B) and express the IL-23R (figure 1G). Immunologically, ILC3 cells produced IL-17 and IL-22, a small percentage of cells co-expressing both cytokines (figure 1K, L). Despite ILC3 having been described to express the transcription factor RORc, in patients with AS these cells were almost totally Tbet+ (figure 1H–J). ILC3 have been developmentally related to LTi cells, this process requiring the IL-7 signalling.12 In this regard, we first evaluated the tissue distribution of LTi cells in the gut of patients with AS and controls. As shown in figure 2, aggregates of c-kit+ (a marker of LTi cells) cells were observed at the bottom of intestinal crypts in the gut of patients with AS (figure 2A) but not of controls (figure 2B). Clusters of CD3−c-kit+Thy1+ cells were confirmed in the gut of patients with AS (figure 2C–F) in close proximity of intestinal crypts indicating with high probability the presence of cryptopatches in AS. Since the important role of IL-7 and IL-15 in modulating the fate of ILCs, we next evaluated their expression at both m-RNA and protein levels. IL-7 and IL-15 were both significantly overexpressed at m-RNA level compared with controls (figure 2G, H). Analysis of tissue expression and distribution of IL-7 (figure 2I) and IL-15 (figure 2J) in the gut of patients with AS showed intense staining only for IL-7 in AS and in particular in the context of epithelial cells located at the bottom of intestinal crypts highly resembling Paneth cells (PC) (figure 2I). IL-7-producing cells in the gut of patients with AS were confirmed to be PC since their co-expression of α-defensin5, a specific marker for PC (figure 2K–M). Since PC in the gut of AS produce IL-23p192 and IL-7, thus potentially participating in the differentiation and expansion of ILCs, we next tried to evaluate whether epithelial cells may drive ILC3 differentiation. Epithelial cell fraction isolated from intestinal biopsies of patients with AS and controls, as previously described,23 was co-cultured with isolated LTi cells obtained from tonsils of normal donors. Co-culture of LTi cells with epithelial cells of AS, but not controls (data not shown), resulted in the expansion of ILC3s (figure 3A–E) producing equal amount of IL-17 and IL-22 (figure 3F), indicating a prominent role of epithelium in driving ILC3s expansion.

Innate lymphoid cells type 3 in the gut of patients with ankylosing spondylitis (AS). (A–D, F, H–K) Representative dot plots showing the gating strategy for innate lymphoid cell (ILC)3 in the gut of patients with AS. (E) Percentage of ILC3 in the ileum of AS patients without intestinal inflammation, acute and chronic inflammation and normal controls (NCs). (F) Representative dot plot showing α4β7 expression on ileal ILC3 of AS patients. (G and H) Representative dot plots showing the expression of interleukin (IL)-23R (G) of RORc (H) and Tbet (I) in ileal ILC3. (J) Percentages of RORc+ and Tbet+ ILC3 in the gut of patients with AS. (K) Representative dot plot showing the cytokine production by intestinal ILC3 of patients with AS. (L) Percentage IL-17 and IL-22 expressing cells among intestinal ILC3. Data are expressed as individual data points (mean). p<0.0001.

Cryptopatches are present and Paneth cells produce interleukin (IL)-7 in the gut of patients with ankylosing spondylitis (AS). (A and B) Representative images showing a cluster of c-kit-stained cells in the gut of a patient with AS (arrow) (A) but not in control (B). (C–F) Cryptopatches in the gut of patients with AS. Representative images of confocal analysis of Thy-1, C-kit and CD3 co-localisation in gut tissues of patients with AS. (C) Single staining for Thy-1; (D) single staining for c-kit; (E) single staining for CD3. Nuclei were counterstained with 4′,6-diamidino-2-phenylindole (DAPI) (insert). (F) Merged triple staining of Thy-1, c-Kit and CD3. Cryptopatches were defined as aggregates of c-kit+Thy-1+CD3− cells. (G and H)RT-PCR for IL-7 and IL-15 in the gut of patients with AS and normal controls (NCs); *p<0.05. (I and J) Representative microphotographs showing IL-7 and IL-15 staining in the gut of patients with AS. IL-7 (I) but not IL-15 (J) was significantly upregulated at the bottom of intestinal crypts. (K–M) Representative images of confocal analysis of IL-7 and α-defensin5 co-localisation in gut tissues of patients with AS. (K) Single staining for IL-7; (L) single staining for α-defensin5; (M) merged double staining of IL-7 and α-defensin5. (A, C–F and K–M) Original magnification ×250. (B) Original magnification ×100. (I and J) Original magnification ×630. Data are expressed as individual data point (mean). *p<0.0001.

Epithelial cells from ankylosing spondylitis (AS) drive innate lymphoid cell (ILC)3 differentiation from lymphoid tissue inducer (LTi) cells. LTi cells were isolated from tonsils of normal donors and co-cultured with epithelial cells isolated for the gut of patients with AS. After co-culture expansion of ILC3 was observed (A–E) with a different modulation of cytokine production (F). Data are expressed as individual data points (mean) or as mean (SD).
ILC3s are expanded in the peripheral blood, synovial fluid and BM of patients with AS and express α4β7 integrin
We next evaluated the frequency of ILC3 in the peripheral blood, synovial fluid and BM of patients with AS. We observed a significant expansion of ILC3 cells in the peripheral blood (figure 4A–E), synovial fluid (see online supplementary figure S4A) and BM blood (5A–E) of patients with AS compared with controls. These cells displayed different cytokine production in the different compartments. In the peripheral blood, ILC3 prevalently produced IL-22, being the production of IL-17 alone or of IL-22/IL17 confined to a small subset of these cells (figure 4K, L). Among synovial fluid and BM mononuclear cells ILC3 produced exclusively IL-22 (figure 5K, L and see online supplementary figure S4B).

Innate lymphoid cells type 3 in the peripheral blood of patients with ankylosing spondylitis (AS). (A–D, F, H–K) Representative dot plots showing the gating strategy for innate lymphoid cell (ILC)3 in the peripheral blood of patients with AS. (E) Percentage of ILC3 in the peripheral blood of patients with AS and normal controls (NCs). (F) Representative dot plot showing α4β7 expression on circulating ILC3 of patients with AS. (G) Percentage of α4β7+ cells among circulating ILC3 of patients and controls. (H–J) Representative dot plots showing the expression of interleukin (IL)-23R on ILC3 (H), of RORc (I) and T-bet (J). (K) Representative dot plot showing the cytokine production by circulating ILC3. (L) Percentage of IL-17-expressing and IL-22-expressing cells among circulating ILC3. Data are expressed as individual data points (mean).

Innate lymphoid cells type 3 in the bone marrow (BM) of patients with ankylosing spondylitis (AS). (A–D, F, H–K) Representative dot plots showing the gating strategy for innate lymphoid cell (ILC)3 in the BM of patients with AS. (E) Percentage of ILC3 in the peripheral blood of patients with AS and normal controls (NCs). (F) Representative dot plot showing α4β7 expression on circulating ILC3 of patients with AS. (G) Percentages of α4β7+ in the BM of patients and controls. (H–J) Representative dot plots showing the expression of interleukin (IL)-23R on ILC3 (H), of RORc (I) and T-bet (J) on BM ILC3. (K) Representative dot plot showing the cytokine production by circulating ILC3. (L) Percentage IL-17-expressing and IL-22-expressing cells among BM ILC3. Data are expressed as individual data points (mean).
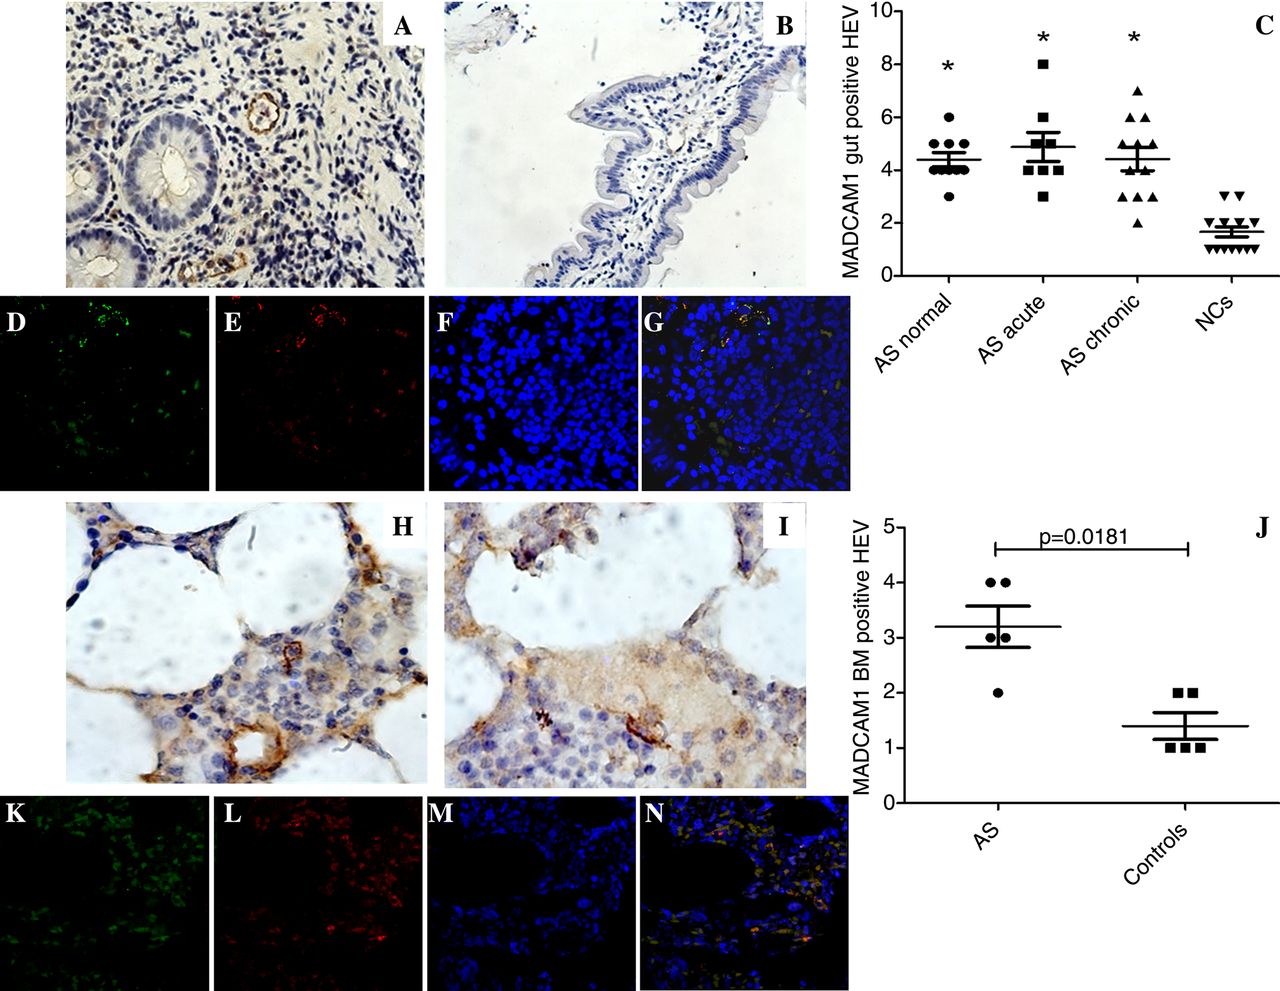
In order to evaluate whether ILC3 present in the peripheral blood and in the different sites of inflammation of patients with AS were from gut origin, we evaluated the expression of α4β7 integrin on their surface. Among peripheral blood and BM ILC3, a significantly higher percentage of ILC3 displayed α4β7 positivity compared with controls (figures 4F, G and 5F, G). Since the specific counter-receptor of α4β7 is the addressin mucosal vascular addressin cell adhesion molecule 1 (MAdCAM1),25 we next evaluated the expression of MAdCAM1 in the gut and in the BM. As shown in figure 6, a significant upregulation of MAdCAM1 was observed in the gut (figure 6A–C) and in the BM (figure 6H–J) of patients with AS compared with controls. In particular, MAdCAM1 immune-reactivity was observed exclusively in high endothelial venules (HEVs) in BM and in close proximity to intestinal crypts in the gut (figure 6A). To confirm the HEV expression of MAdCAM1, gut and BM sections of patients with AS were stained for MAdCAM1 and PNAd, a specific marker for HEV, showing that HEV express MAdCAM1 in AS ileum (figure 6D–G) and BM (figure 6K–N). Altogether these findings should indicate a gut origin for circulating and tissue ILC3 in AS.
Mucosal vascular addressin cell adhesion molecule 1 (MADCAM1) expression in the gut and in the bone marrow of patients with ankylosing spondylitis (AS). (A and B) Representative images showing MADCAM1 expression in the gut of patients with AS (A) and controls (B). (C) Quantification of MADCAM 1 expression in the gut of patients and controls; *p<0.05. (D–G) Representative images of confocal analysis of MAdCAM1 and PNAd co-localisation in gut tissues of patients with AS. (D) Single staining for MAdCAM1; (E) single staining for PNAd; (F) nuclei counterstained with toto-3 (blue). (G) Merged double staining of MAdCAM1 and PNAd. (H and I) Representative images showing MADCAM1-positive cells in the bone marrow of patients with AS (H) and controls (I). (J) Quantification of MADCAM1 in the bone marrow of patients with AS and controls. (K and N) Representative images of confocal analysis of MAdCAM1 and PNAd co-localisation in bone marrow biopsies of patients with AS. (K) Single staining for MAdCAM1; (L) single staining for PNAd; (M) nuclei counterstained with toto-3 (blue). (N) Merged double staining of MAdCAM1 and PNAd. (A and B, D–G and K–N) Original magnification ×250. (H and I) Original magnification ×630.
TNF-blocking agents reduce the percentage of circulating and gut ILC3 and the expression of MAdCAM in the gut of patients with AS
TNF-blocking agents have been demonstrated to reduce the inflammation in patients with AS and to modulate several immunological functions.26 The demonstration of an effect of TNF-blocking agents on ILC, if any, is however lacking. Five patients with AS treated with TNF-blocking agents were reassessed for the frequency of circulating and intestinal ILC3 and for the gut expression of MAdCAM-1. As shown in online supplementary figure S5, anti-TNF therapy results in a significant clinical amelioration, a significant reduction of ILC3 at both systemic (see online supplementary figure S5A–C) and gut level (see online supplemental figure S5D–F) and a strong reduced expression of MAdCAM1 in ileal samples (see online supplementary figure S5G), indicating a role this therapeutic strategy plays in modulating also the innate immune responses in patients with AS.
Discussion
In this study, we provide the first evidence that a unique innate immunological signature characterises the gut of patients with AS and suggests that gut cell migration of ILC3 might be involved in the development of AS. Type 3 ILC, which we defined as Lyn−IL-23R+NKp44+Tbet+RORc− cells, were found to be expanded in the gut but also in the peripheral blood, in the synovial fluid and in the BM of patients with AS and express the homing integrin α4β7. In addition, MAdCAM1, the α4β7 ligand, was found to be highly represented in the gut and in the inflamed BM of AS, suggesting that a recirculation of ILC3 between the gut and the BM occurs. In particular, ILC3 were predominantly expanded in the more inflamed gut of AS compared with the acute and chronic inflamed intestine of patients with AS, and produced both IL-17 and IL-22. Finally, in the anti-TNF-treated patients, we observed a significant reduction of intestinal and circulating ILC3 and of the gut MADCAM1 expression. Altogether these results suggest a role for IL-23-sensitised gut-resident ILC3 migration in the development of AS.
ILCs are different populations of cells with lymphoid characteristics but without rearrangement of antigen receptors, mainly distinguished into three groups: IFN-γ-producing ILC1 cells, T helper type 2 cytokines producing ILC2 cells, and IL-17 and IL-22 producing ILC3 cells that are associated with the gastrointestinal mucosa.9 ,27–29 Differently from the ‘classic’ group, the ILC3 we found in AS were characterised by the high expression of IL-17 and IL-22 and of the transcription factor T-bet. The high percentage of IL-17+ILC3 cells we observed was unexpected compared with murine studies and may suggest a predominant innate source of IL-17 in AS gut. Finally, the absence of RORc in AS intestinal ILC3 could be related to a specific stage of differentiation of these cells since it has been demonstrated that ILC3s may follow a differentiation programme in which they first upregulate T-bet, then acquire NCRs and then downregulate RORγt, allowing for phenotypic and functional plasticity.30–32
The mammalian gastrointestinal tract contains a well-organised immune system consisting of the gut-associated lymphoid tissues that includes the Peyer's patches and the isolated lymphoid follicles (ILFs). Subclinical gut inflammation of patients with AS has been demonstrated to be characterised by a significant increased number of lamina propria ILF.33 In mice, ILF formation is induced postnatally by commensal microbiota and requires the formation of cryptopatches, structures containing LTi cells (a distinct population of group 3 ILCs).6 ,34 ,35 During ILF genesis, intestinal epithelial cells produce IL-7 that signals via the IL-7 receptor LTi cells to induce the expression of lymphotoxin α1β2,34 ,35 acting on resident lymphoid tissue organiser cells for the organisation of lymphocytes into the cryptopatches. ILC3 in humans have been developmentally related to LTi cells, and this process seems to be also dependent on the IL-7 signalling.11 ,12 Although cryptopatches have been extensively demonstrated in murine intestine, in humans their presence has been proved only in colon,36 being lacking a definitive demonstration of their presence in small intestine. In this study, we, however, provide the first demonstration of the presence of aggregates of LTi in the small intestine of patients with AS but not in controls, in close proximity to intestinal crypts, these structures being highly suggestive for cryptopatches. The absence of cryptopatches in normal ileal samples we observed could suggest that, in physiological conditions, they may exist only during a small window of time just after birth or, alternatively, that they need bacterial stimulation to develop. Postnatal development of cryptopatches, in fact, seems to be dependent by the presence of bacteria and ileal dysbiosis has been recently proved in AS.37 Cryptopatches have been hypothesised to be sites of active extrathymic T cell development.38–40 In this regard, we also demonstrated that specialised epithelial cells in the gut of AS, PC, do express IL-7 and that co-culture of LTi with epithelial cells isolated from patients with AS strongly induces the differentiation of ILC3, also increasing the expression of IL-17 and IL-22. Our results might suggest a pivotal role of these specialised epithelial cells in activating and amplifying intestinal innate immune responses in the gut of patients with AS resulting in active ILC3 differentiation.
An intriguing theory linking gut and joint inflammation concerns the aberrant trafficking of gut-derived T cells.41 Recently, an entheseal subset of T cells, highly responsive to IL-23, has been described in a murine model of spondyloarthritis.5 Although the intestinal presence of these cells was not studied in the paper by Sherlock,5 several immunological similarities are shared between the murine entheseal T cells and ILC3 we described in our study. Both murine and humans cells were in fact Lyn negative, do express the IL-23R and produce IL-17 and IL-22. ILC3 were also characterised by a strong expression of the integrin α4β7 that has been demonstrated to regulate the homing of intestinal T cells.42 Interestingly, MAdCAM1, the counter-receptor of α4β7,43 was significantly upregulated in the HEVs of the gut and the BM of patients with AS, suggesting a role for this receptor in chemoattracting ILC3 at the site of active AS inflammation.
A strong correlation has been recently demonstrated between the presence of gut inflammation and the degree of spinal inflammation in AS.44 In this regard, our study indicates that a gut–joint/spine axis exists in AS where ILC3 actively differentiate in the gut and migrate in extraintestinal sites where, through the production of IL-17 and IL-22, they may be responsible for the induction of inflammation. Data on the effect of anti-TNF treatment on circulating and gut ILC3 and of MADCAM1 expression in the gut point towards a more complex anti-inflammatory pathway of this class of drugs.
Acknowledgments
We thank Dr Francesca Raiata for her technical support in immunohistochemical experiments.
References
Supplementary materials
Supplementary Data
This web only file has been produced by the BMJ Publishing Group from an electronic file supplied by the author(s) and has not been edited for content.
Files in this Data Supplement:
- Data supplement 1 - Online table
- Data supplement 2 - Online figures
Footnotes
Handling editor Tore K Kvien
Contributors FC, GG, AR, RA, GS, GDL and GT designed the study and analysed the data FC, GG and AG selected and enrolled the patients. FC, GG, AR, LS, SP, AG, AC and GS performed the experiments and analysis of the results. SP performed ileocolonoscopy and ileal biopsy. FC and GT wrote the paper. FC and GG performed the statistical analysis. GT, GDL and RA provided overall supervision.
Funding This study was partially supported by a grant from Ministero della Università e della Ricerca Scientifica of Italy.
Competing interests None declared.
Patient consent Obtained.
Ethics approval Ethical committee and the institutional review board of the University of Palermo.
Provenance and peer review Not commissioned; externally peer reviewed.